LIPOPRINT® PROFILE
UNDERSTANDING AND ANALYZING THE TEST RESULTS

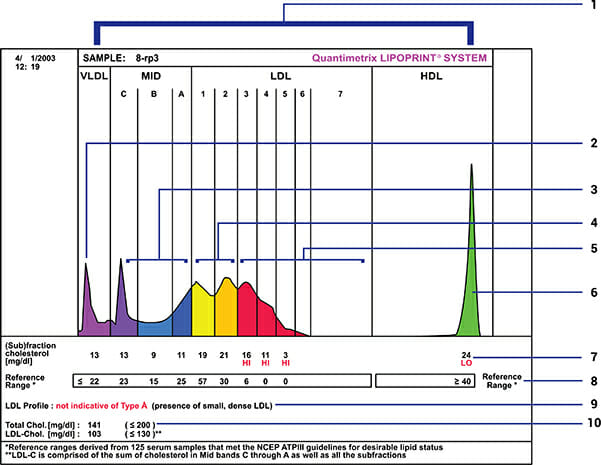
- Measurement of up to twelve lipoprotein fractions and subfractions. Results for every lipoprotein subfraction reported as mg/dL cholesterol which should be the basis for patient treatment.
- VLDL increased levels – associated with hypertriglyceridemia, one of the components of the lipid triad of atherogenic dyslipidemia.
- Atherogenic subfractions Midbands B and C (include VLDL remnants and IDL): associated with atherogenic Type III dyslipidemia and combined hyperlipoproteinemia.
- Non-atherogenic subfractions Midband A, LDL 1 and 2 (large buoyant LDL): not associated with CVD risk
- Highly atherogenic subfractions LDL 3 through 7 (small dense LDL): component of the lipid triad associated with 3 fold increase of CVD, metabolic syndrome and diabetes.
- HDL cholesterol (good cholesterol) – Low HDL is a component of the lipid triad associated with increased CHD risk.
- Cholesterol values outside the normal reference range are flagged in red for ease of interpretation. Elevated Mid B, Mid C (IDL and VLDL remnants) and small-dense LDL 3 through LDL 7 pose the highest risk for CVD.
- Normal Reference Range for each subfraction based on NCEP ATP III guidelines for desirable lipid levels.
- Lipoprotein Profile Classification – predominance of large LDL is classified as Type A and predominance of small dense LDL is classified as Not Indicative of Type A.
- Traditional risk factors – Total cholesterol – CHD risk factor.
COLOR-CODED PROFILE
The Lipoprint Profile is color-coded making it easy for doctor and patient to understand the results of the test at a glance. Good HDL is shown in green; large low risk LDL 1 and 2 in yellow; for caution, and the atherogenic; small dense LDL 3 through 7 in red; for high risk.
